Few metrics are so indicative of business health like churn and retention. For SaaS, those are the metrics: as fundamental as fundamental metrics go.
In subscription-based businesses, churn rate shows the percentage of customers lost, while customer retention rate reveals how many stay. A high churn rate can point to product or satisfaction issues, while a high retention rate signals loyalty and strong product-market fit. Tracking both (whether monthly or annually) helps balance acquisition, reduce revenue churn rate, and sustain growth.
The truth is, that doing that is easier said than done. In this article, let's try to figure out and understand how to measure both of these metrics.

What Is Churn Rate
Also called customer churn rate, churn rate is the percentage of customers who stop using your product or service within a specific time frame. It’s one of the most important subscription business metrics, revealing how effectively you retain users and protect revenue.
A high churn rate can indicate gaps in product value, weak onboarding, or declining customer satisfaction. For SaaS companies, tracking monthly churn rate or annual churn rate helps spot trends early and prioritize retention efforts before they impact long-term growth.
By comparing your churn rate to your customer retention rate, you get a complete view of loyalty, engagement, and overall business health.
How to Calculate Churn Rate
To measure churn rate, divide the number of customers lost in a given period by the number of customers you had at the start of that period, then multiply by 100.
Churn Rate Formula:
To measure churn rate, divide the number of customers lost in a given period by the number of customers you had at the start of that period, then multiply the result by 100.
When calculating monthly churn rate or annual churn rate, exclude newly acquired customers to avoid skewed results. This ensures you’re measuring true attrition, not offsetting it with new signups. Tracking this alongside customer retention rate highlights whether changes in churn are due to improved loyalty or short-term acquisition spikes.
Churn Rate Formula Explained
The churn rate formula is straightforward: customers lost during a specific period divided by customers at the start of that period, multiplied by 100. You can apply it to calculate monthly churn rate, quarterly churn rate, or annual churn rate, depending on your business model.
It’s important to exclude new customers acquired during the same period. Mixing them in can artificially lower your customer churn rate and hide retention issues. Consistently applying the same calculation method makes it easier to compare churn over time and measure the impact of retention strategies.
What Is a Good Churn Rate
A “good” customer churn rate depends on your industry and business model. In B2B SaaS, a monthly churn rate below 5% is generally acceptable, while 1–2% is ideal. B2C products often face higher churn due to lower switching costs and more casual usage patterns.
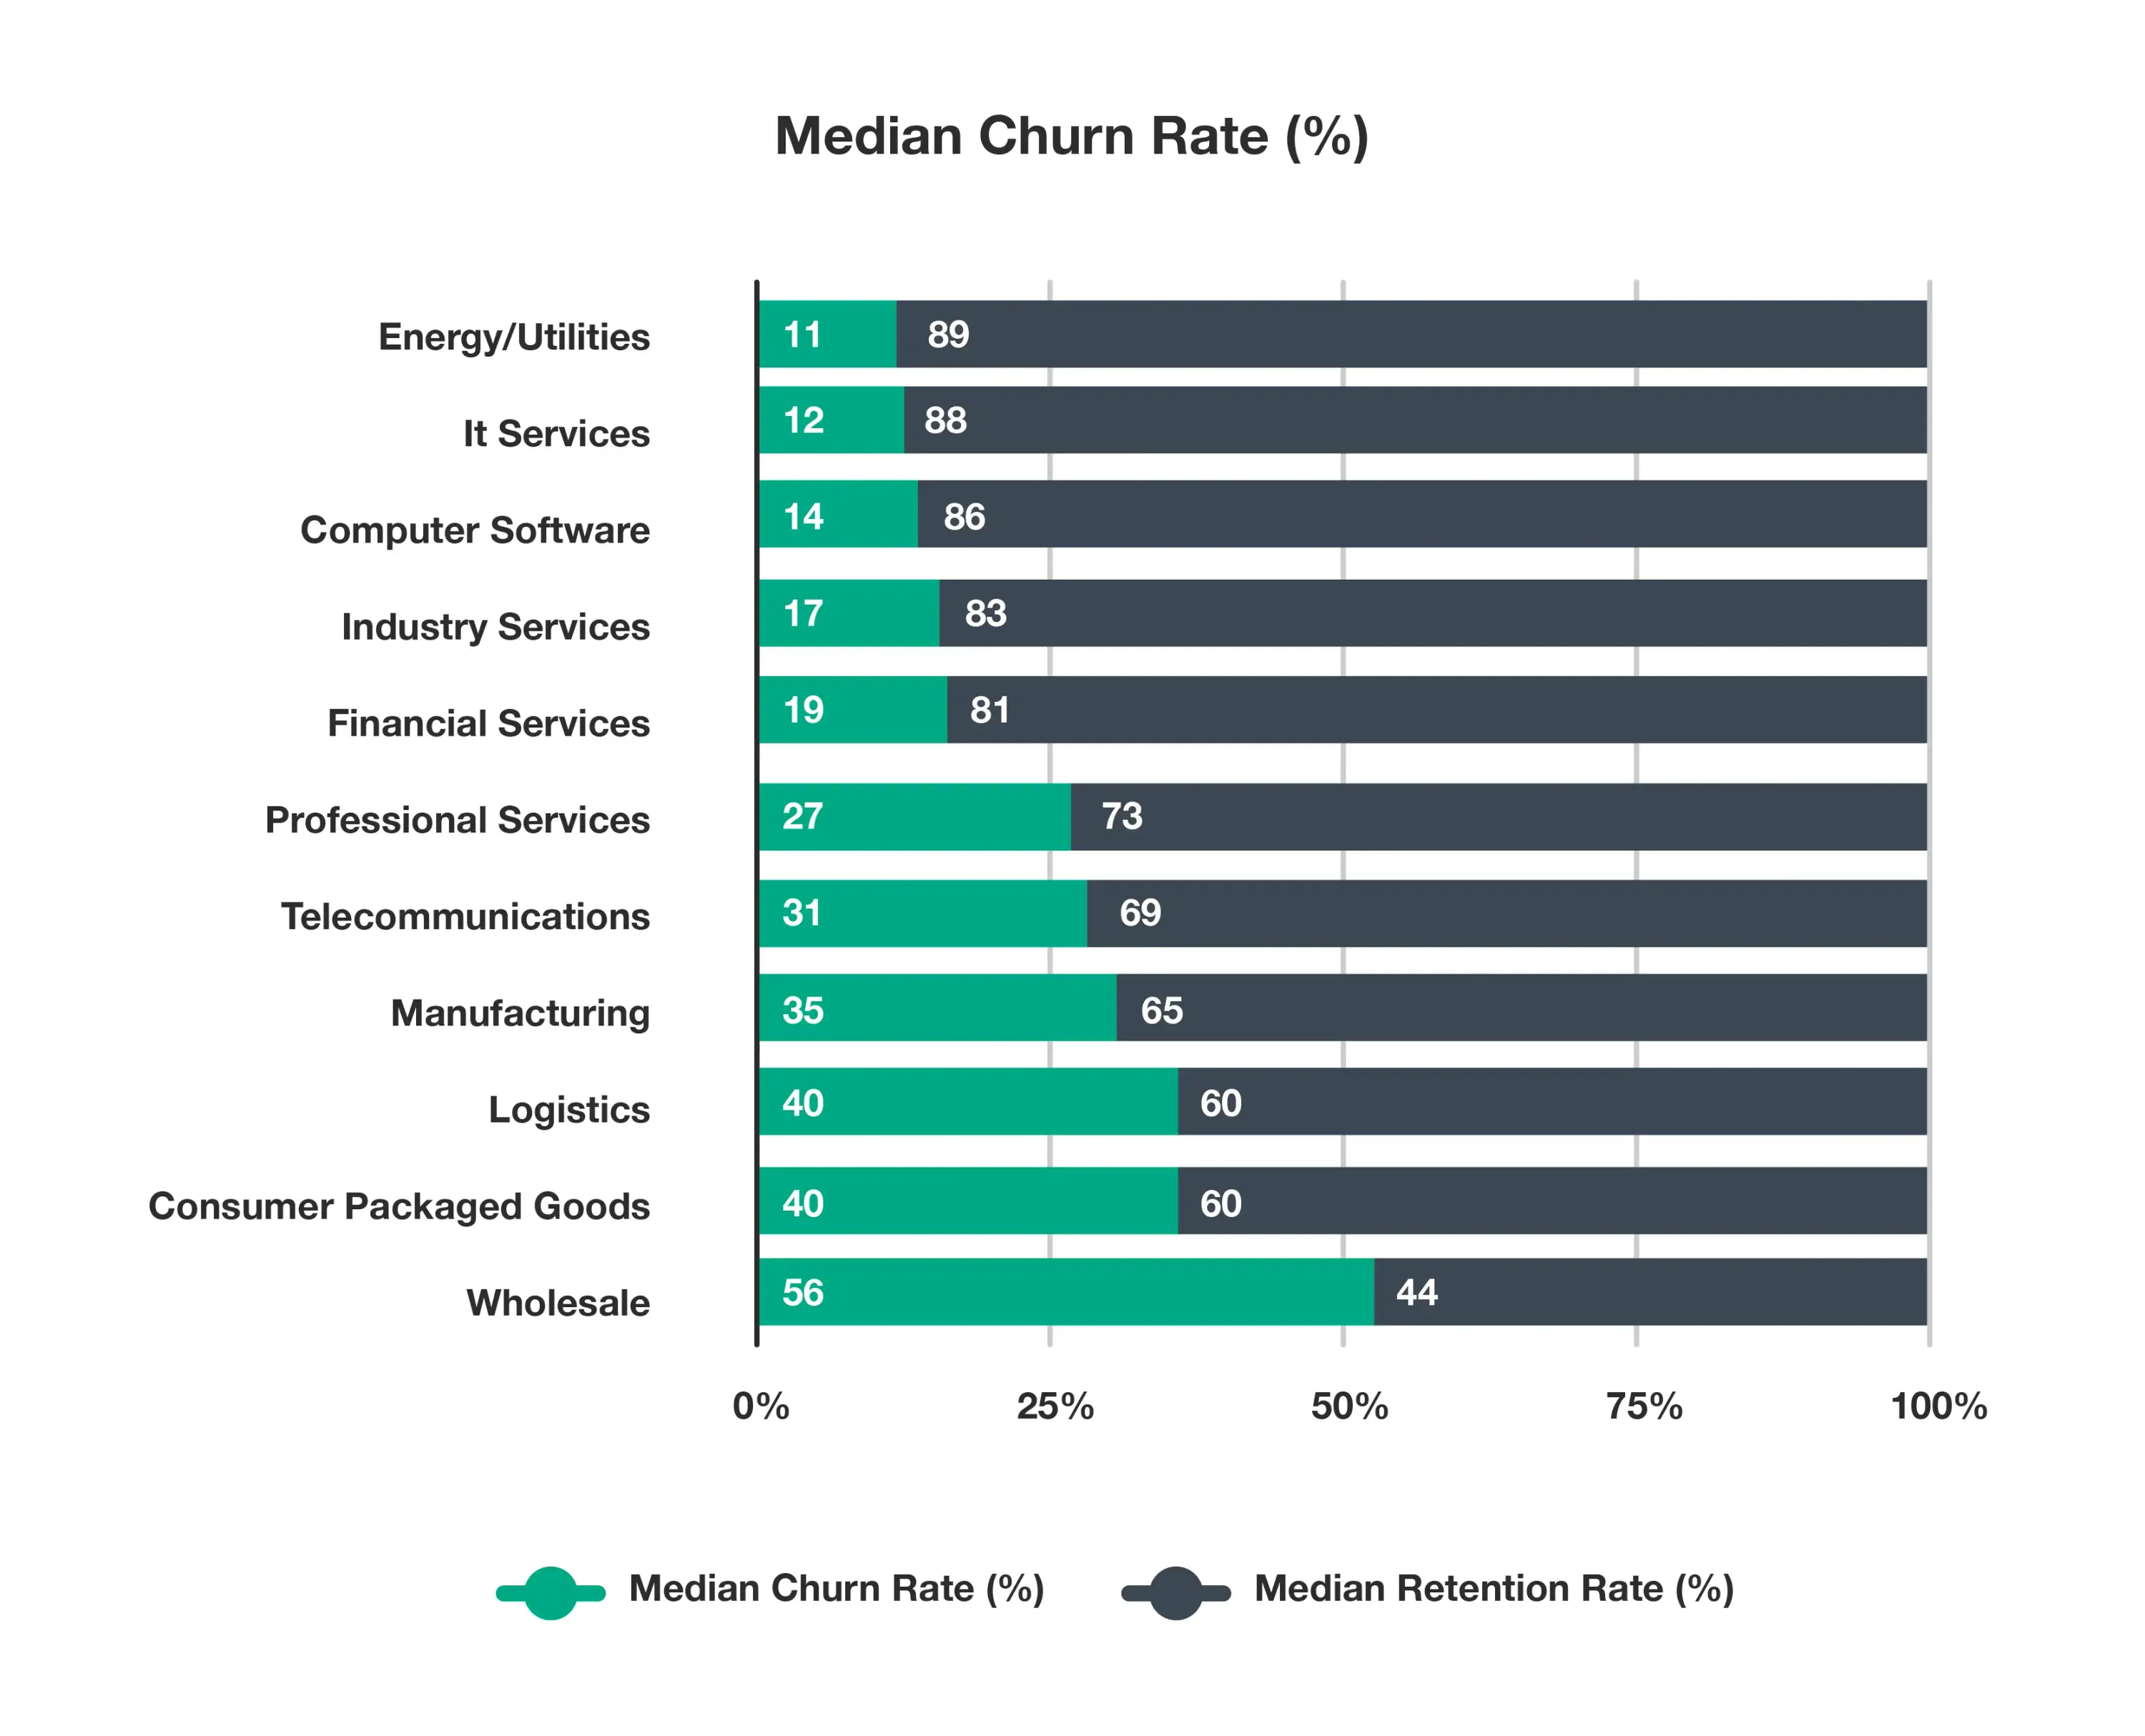
The lower your revenue churn rate, the easier it is to achieve sustainable growth, especially when paired with a high customer retention rate. Regularly benchmarking your churn against industry standards helps identify whether you’re ahead of competitors or at risk of losing market share.
Involuntary Churn and How to Avoid It
Involuntary churn occurs when customers are lost due to failed payments, expired cards, or technical issues rather than dissatisfaction. While it still impacts your overall customer churn rate and revenue churn rate, it’s often easier to fix than voluntary churn.
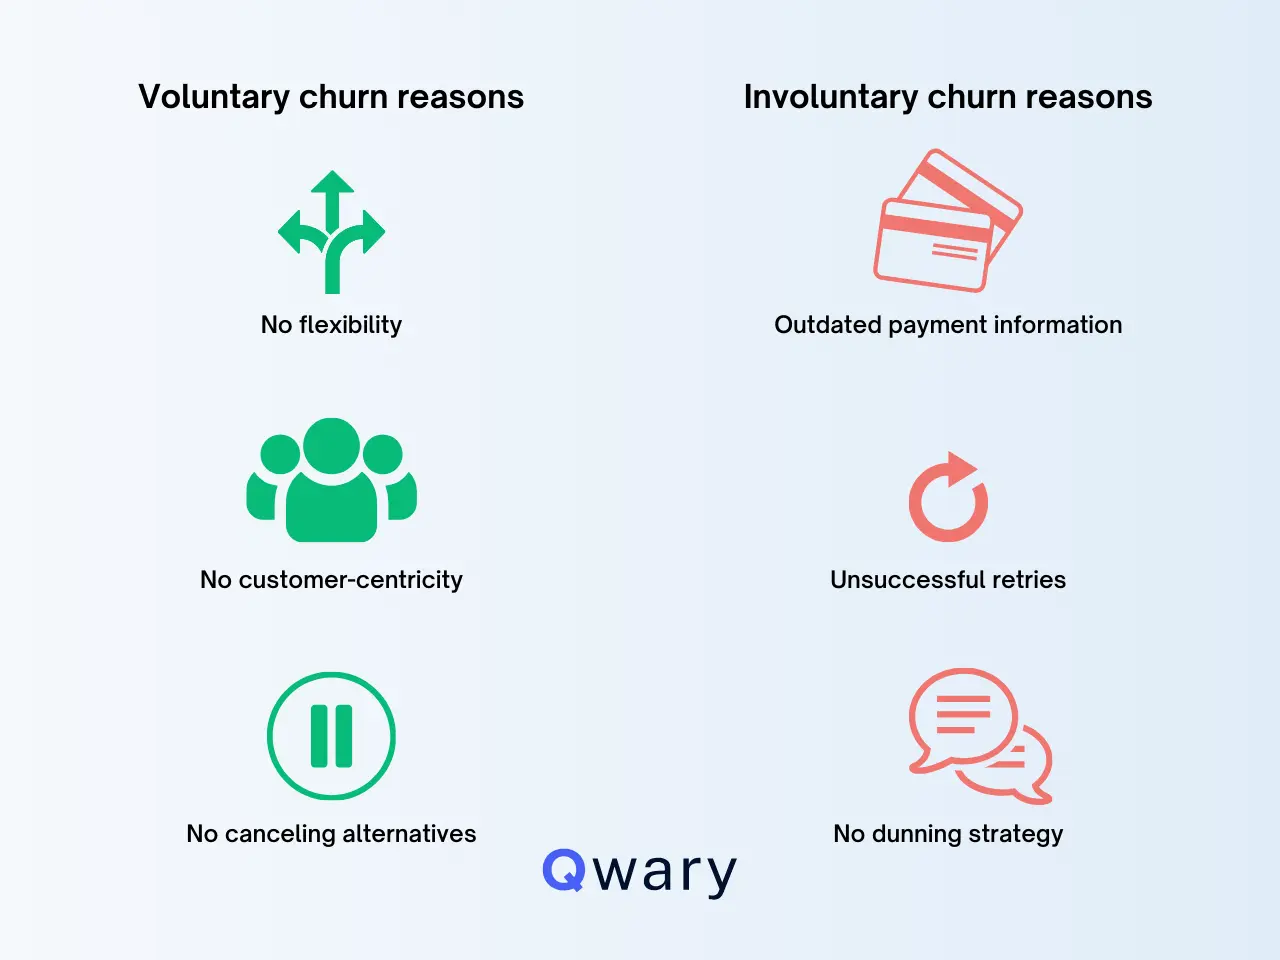
You can reduce involuntary churn by using smart billing retries, sending timely dunning emails, and setting up clear payment recovery workflows. For subscription businesses like SaaS, even small improvements here can meaningfully lower monthly churn rate and increase customer retention rate without major product changes.
What Is Customer Retention Rate
Customer retention rate measures the percentage of customers who continue using your product or service over a specific period. A high customer retention rate signals strong product-market fit, sustained engagement, and long-term loyalty, while a low rate often mirrors a high customer churn rate.
Tracking user retention rate (monthly, quarterly, or annually) helps you see how well your business delivers ongoing value. When compared with your churn rate, it provides a complete view of customer loyalty and the effectiveness of your retention strategies.
Customer Retention Rate Formula
The standard formula is:
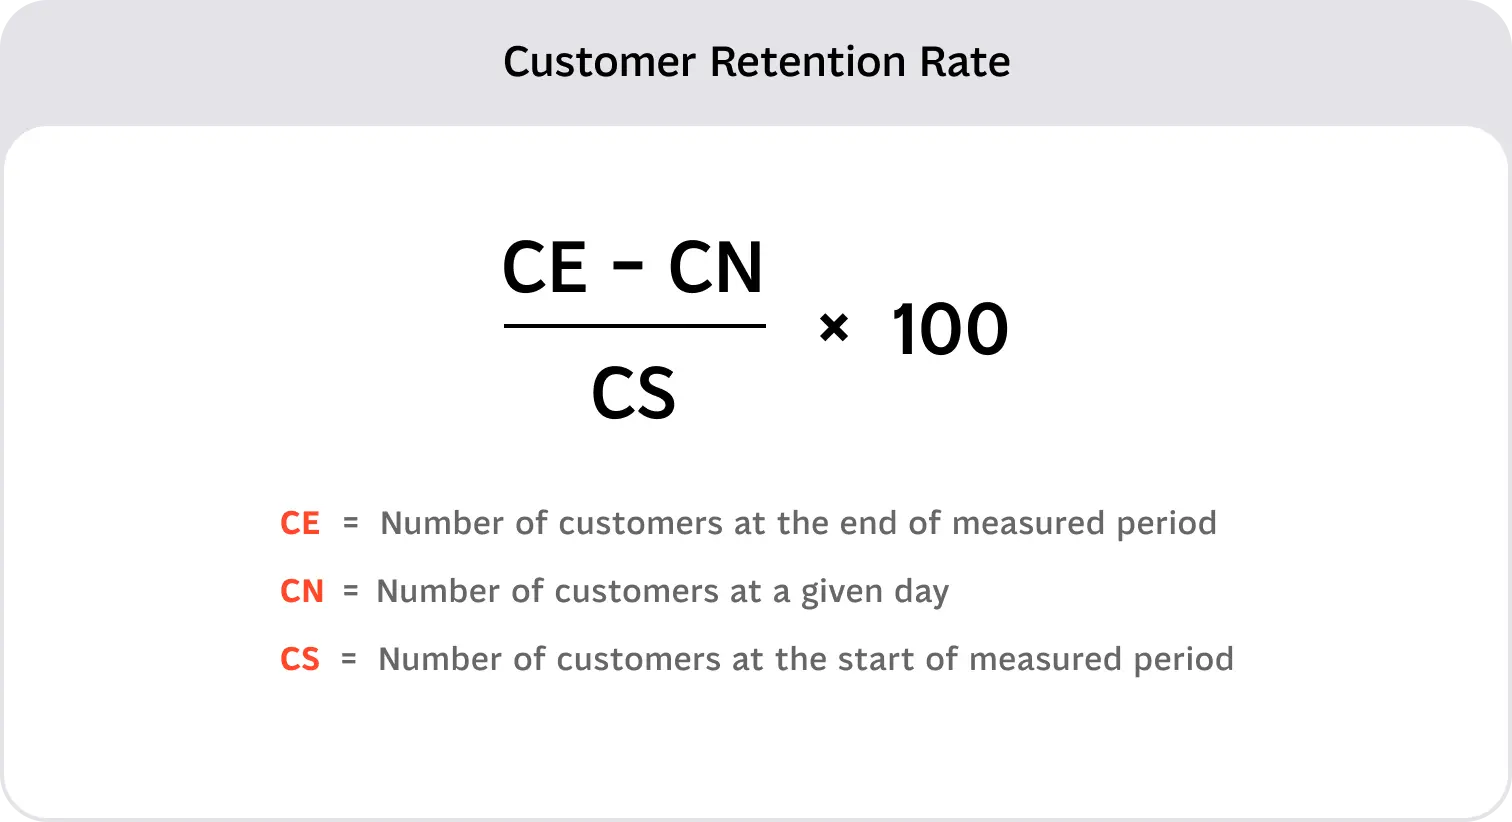
Tracking user retention rate this way makes it easier to compare trends, evaluate the impact of retention initiatives, and see how changes in customer churn rate affect long-term growth.
How to Calculate Retention Rate
To calculate customer retention rate, identify how many existing customers stayed with you over a set period, excluding any new customers acquired during that time. Divide this number by your starting customer count, then multiply by 100.
Measuring user retention rate monthly or annually can reveal patterns in engagement and loyalty. Comparing this with your customer churn rate shows whether changes are driven by better retention strategies or by temporary acquisition boosts.
What Is a Good Customer Retention Rate
A “good” customer retention rate varies by industry and product type. For SaaS, a monthly user retention rate above 85–90% is considered strong. B2B products often see higher retention than B2C, thanks to longer contracts and higher switching costs.
The higher your customer retention rate, the lower your customer churn rate—and the more stable your revenue. Regularly benchmarking your retention against industry norms helps identify whether your loyalty strategies are working or need improvement.
Increase Your Retention Rate With These Strategies
Improve onboarding clarity and speed
Help users reach their first value moment quickly through guided walkthroughs, tooltips, or onboarding emails tailored to their goals. Faster adoption drives a higher customer retention rate and lowers customer churn rate.
Personalize communication and product experience
Use behavior-based segmentation to trigger relevant product tips, feature prompts, or targeted emails, improving user retention rate over time.
Offer proactive, high-quality customer support
Quick, effective responses (live chat or AI chatbots) reduce frustration, keeping both customer retention rate high and revenue churn rate low.
Deliver value through regular updates or insights
Product updates, feature improvements, and personalized usage reports reinforce ongoing value, helping maintain a high customer retention rate.
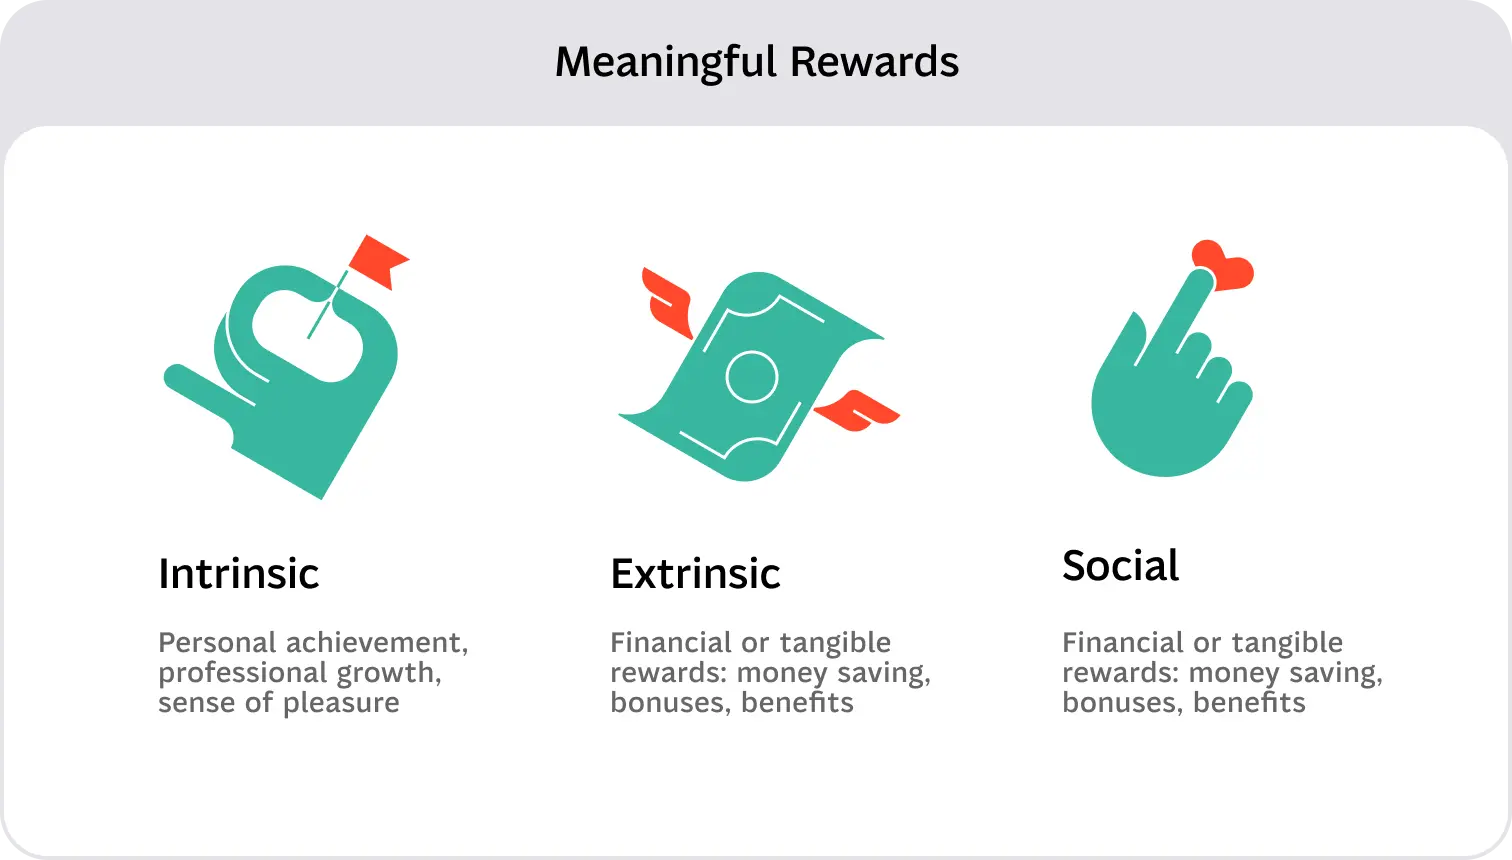
Reward loyalty
Loyalty programs, milestone recognition, or personal thank-you messages strengthen long-term engagement and reduce monthly churn rate. This is what ensures good product stickiness.
Monitor engagement to flag drop-off risks
Track activity patterns and intervene early when usage drops, preventing churn before it happens.
Act on feedback
Regularly collect user input and show that changes are based on customer suggestions to build trust and boost retention.
Encourage long-term commitments
Discounted annual plans or bundles lock in customers, reducing customer churn rate and increasing revenue retention.
Churn Rate vs Retention Rate
Churn rate and customer retention rate measure opposite sides of the same relationship. Churn rate focuses on the percentage of customers lost in a given period, while retention rate tracks those who stay.
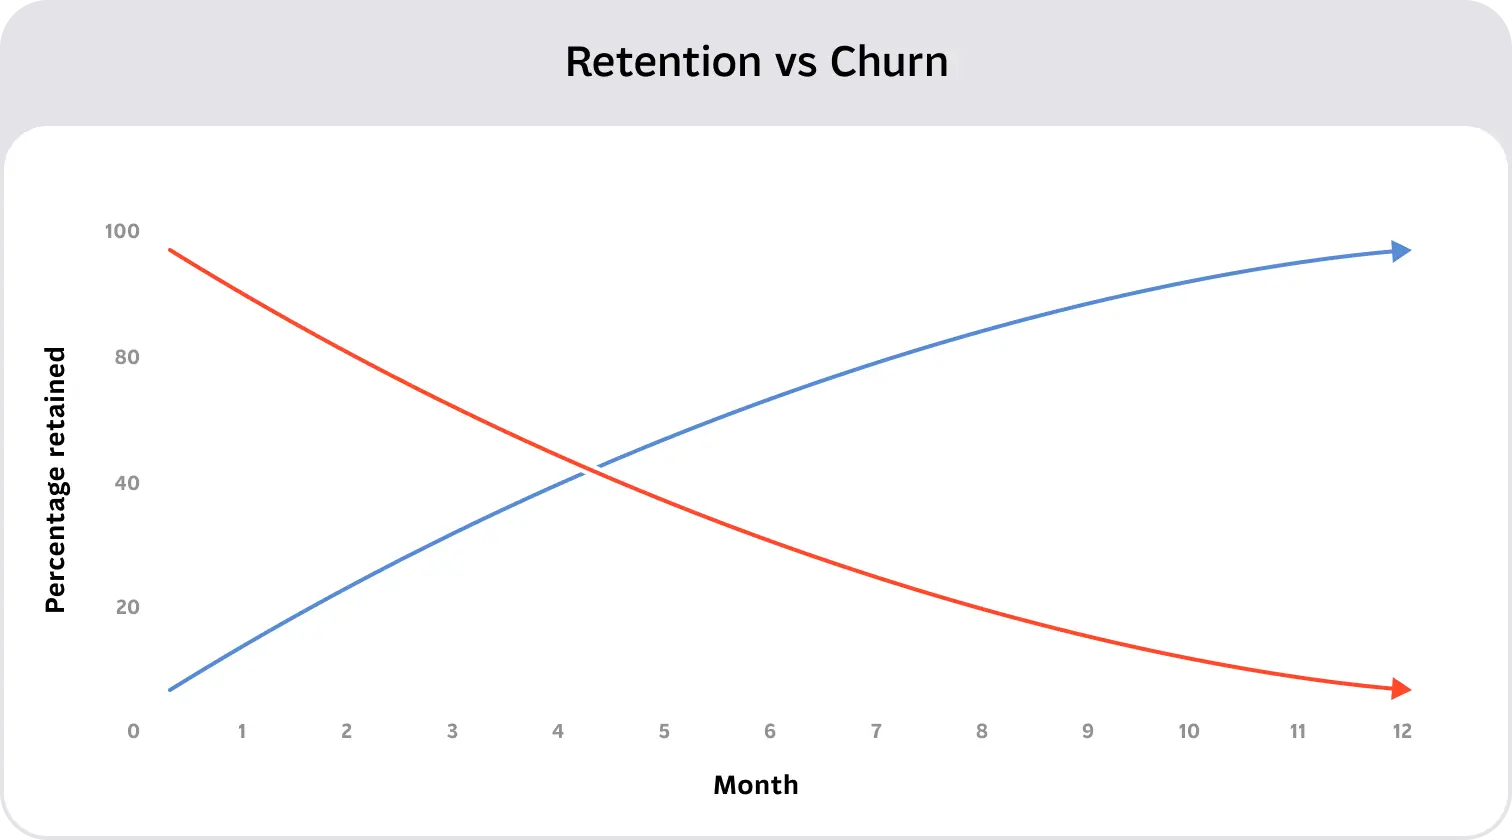
Monitoring both metrics, whether you look at monthly churn rate and user retention rate or their annual equivalents, gives a balanced view of loyalty, engagement, and growth stability. A low customer churn rate paired with a high customer retention rate signals a healthy, sustainable business.
How to Reduce Churn and Improve Retention: Key Tactics
Lowering your customer churn rate starts with understanding why users leave, whether from poor onboarding, low engagement, or payment issues. Addressing these causes directly helps protect revenue and maintain a high customer retention rate.
Effective tactics include:
- Enhancing onboarding to reduce monthly churn rate and increase early adoption.
- Personalizing communication to improve user retention rate.
- Monitoring usage data to spot early drop-off signals and prevent churn.
- Using proactive customer support to lower revenue churn rate.
Combining these approaches ensures a healthier balance between acquisition and retention.
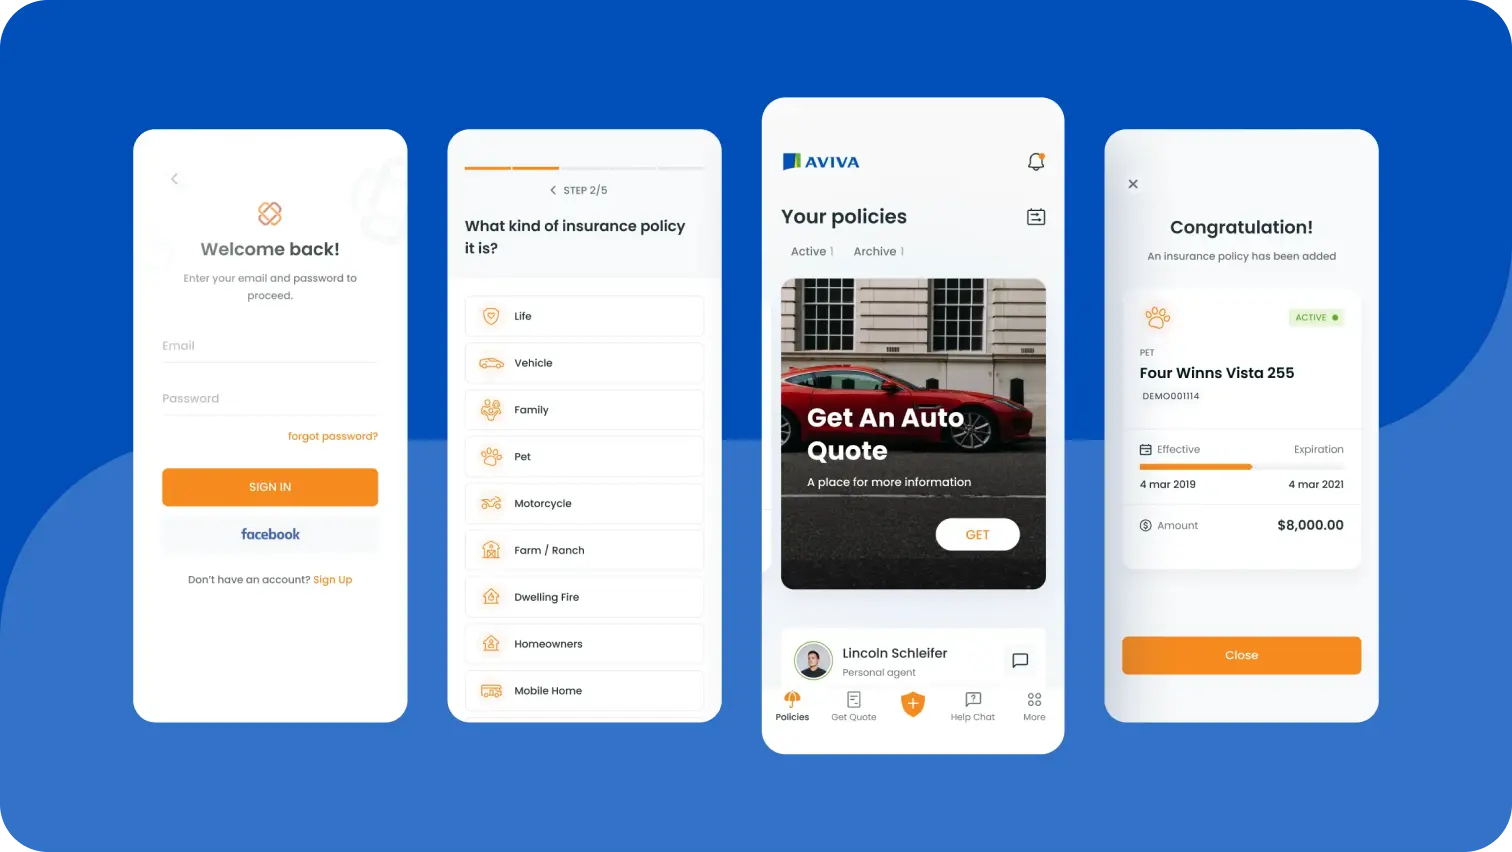
Improve Retention Through Better Customer Experience
A strong customer experience directly impacts both customer retention rate and customer churn rate. Clear onboarding, intuitive design, and personalized engagement help users see value quickly, while reliable support builds long-term trust.
When customers feel understood, supported, and consistently benefit from your product, they’re more likely to stay, driving a higher user retention rate and lowering monthly churn rate. Investing in CX isn’t just good service; it’s a retention strategy that safeguards revenue and reduces revenue churn rate.
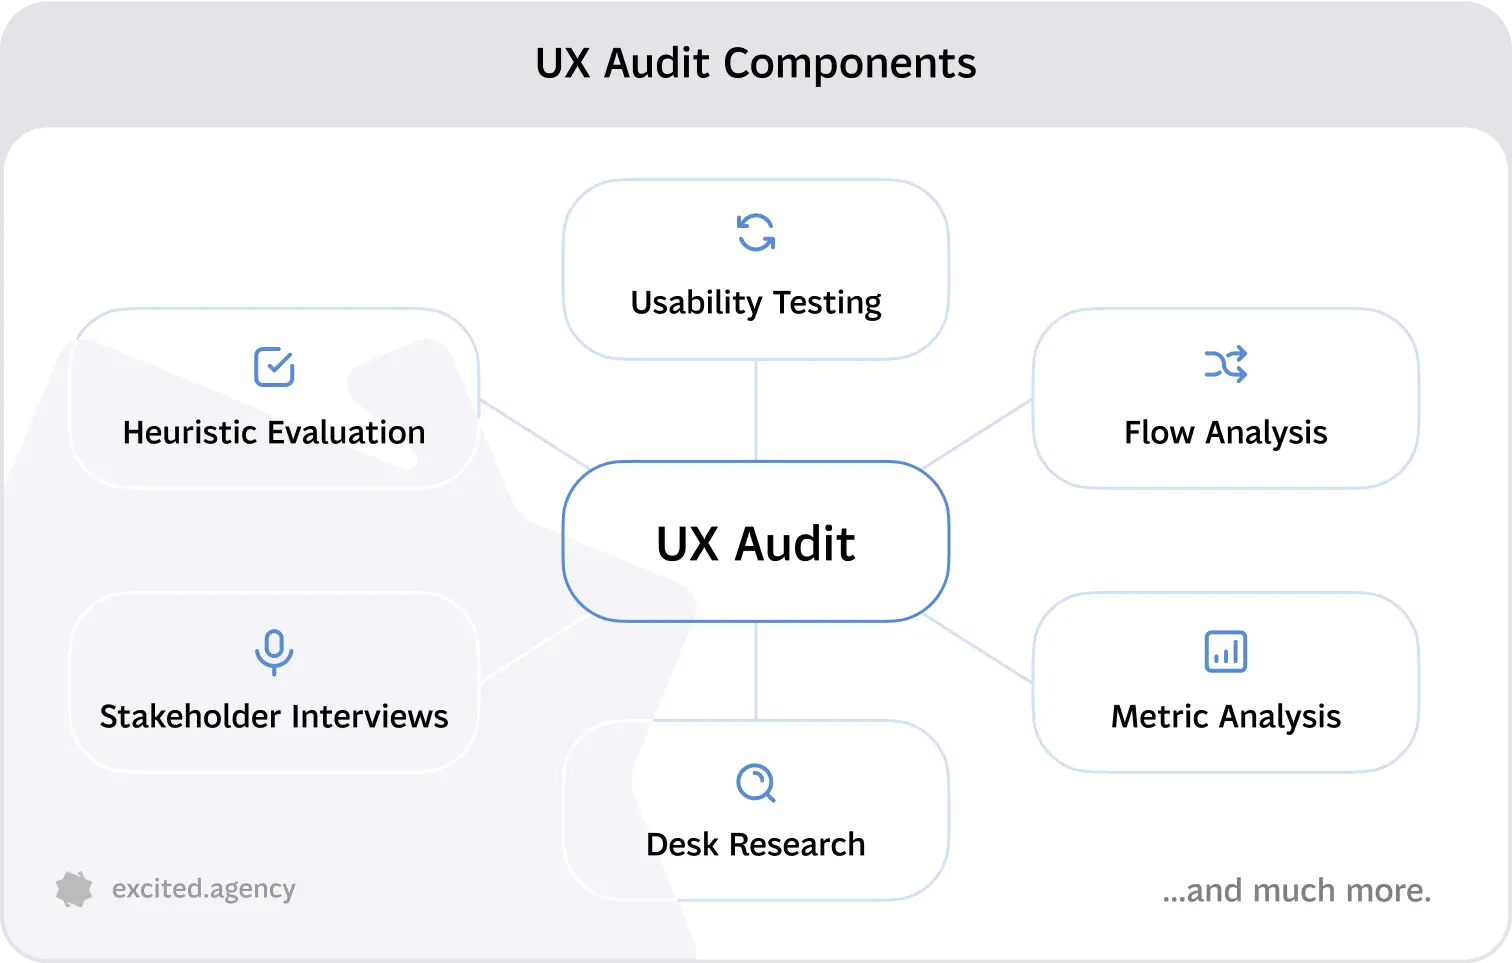
Ocasionally, products may benefit from a complete app redesign or a ux audit. Below, we've listed some of the activities that may go into such audit, the aim of which is to locate potential issues resulting in poor churn and retention.
Monitoring Customer Churn and Retention Rates Over Time
Tracking customer churn rate and customer retention rate regularly helps spot trends before they impact growth. Cohort analysis can reveal when churn spikes, while retention tracking shows how engagement strategies are performing.
By monitoring both monthly churn rate and user retention rate, businesses can quickly assess the impact of product changes, marketing campaigns, or support improvements. Consistent measurement turns these metrics into actionable insights for reducing revenue churn rate and boosting loyalty.
Final Thoughts on Churn and Retention
Both customer churn rate and customer retention rate are core indicators of business health. They don’t just reflect customer behavior — they influence it. A lower monthly churn rate combined with a higher user retention rate signals strong product value, satisfied customers, and revenue stability.
Companies that treat these metrics as strategic levers can scale more sustainably, reduce revenue churn rate, and create lasting customer relationships.
Knowing your customer churn rate and customer retention rate provides clear insight into customer satisfaction, product fit, and revenue stability. Without this understanding, marketing and acquisition efforts may be undermined by preventable losses. Tracking both monthly churn rate and user retention rate ensures growth is sustainable rather than short-lived.
Service short description